What is Icinga?
Icinga is an open source computer system and network monitoring application. It was originally created as a fork of the Nagios system monitoring application in 2009.
Icinga is attempting to get past perceived short-comings in Nagios' development process, as well as adding new features such as a modern Web 2.0 style user interface, additional database connectors (for MySQL, Oracle, and PostgreSQL), and a REST API that lets administrators integrate numerous extensions without complicated modification of the Icinga core.
The Icinga developers also seek to reflect community needs more closely and to integrate patches more quickly. The first stable version, 1.0, was released in December 2009, and the version counter had risen every couple of months as of January 2010.
Icinga was included by Jeffrey Hammond of Forrester Research in a list of "waxing" (as opposed to "waning") open source projects based on its rate of commits.
The name Icinga is a Zulu word meaning "it looks for", "it browses" or "it examines" and is pronounced with a click consonant.
Performance oriented
Icinga 2 is built to be fast. Thanks to its multithreaded design, it can run thousands of checks each second without any sign of CPU strain.
Distributed
Combine high availability clusters with a distributed setup, and you have a best practice scenario for large and complex environments.
Rule based Configuration
Monitoring as code with dynamic configurations. Apply rules to hosts and services to create a continuous monitoring environment.
REST API
With the RESTful API of Icinga 2 you can update your configurations on the fly or show live information about current problems on your custom dashboards. You can process check results from third party tools or tell the Core to run actions interactively. The interface is secured with SSL. Access control can be configured fine grained and per user.
Performance Monitoring
Icinga 2 supports Graphite and InfluxDB natively. You can send performance data gathered by the monitoring plugin directly to the third party tools. Enriched with metadata information from Icinga you will get an even better insight into the current or historical state of your hosts and services.
Alerting
When a problem occurs, you will be notified. Be it via e-mail, text message or mobile message applications, Icinga makes sure you don’t miss any outage of your systems. Configure users and groups statically or import them from your existing solution. With apply rules you can dynamically decide who will get the notification and how the escalation chain looks like. All common SaaS solutions for alert and incident management are supported as well.
Personal Experience:
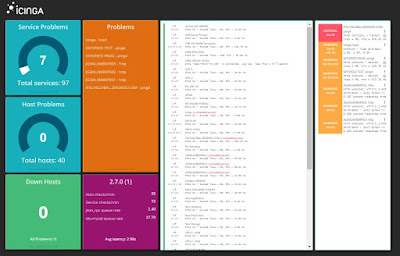
I have past experiences on Nagios and Zabbix monitoring but both were a bit heavy in terms of resource consumption. Also it takes some time for the configuration of Nagios to monitor Windows systems. With icinga2, I noticed some difference in terms of performance. I have configured it on a virtual box running 2gb of RAM on a single CPU with Ubuntu 16.04 and yet performance is not an issue even though I am still using the workstation itself. I also configured dashing and customized it the way I want.
Below is my step by step video on how you can easily add Windows hosts on icinga2 server.
Please like and share my facebook page: https://www.facebook.com/tipsandtreats
Please subscribe to my youtube channel: https://www.youtube.com/user/almarlibetario
How to add Windows Hosts to Icinga2 v2.7 (Ubuntu 16.04)
 Reviewed by RigorMortis
on
October 20, 2017
Rating:
 Reviewed by RigorMortis
on
October 20, 2017
Rating:


No comments: